

You can create YouTube Analytics Dashboard and assign it to Digital Signs very quickly using Google Data Studio. It's free from Google and it already have YouTube Analytics Dashboard template and data integration.
High level steps:
1) Create and account & Log in to Google Data Studio (it's free)
2) Link your YouTube account to get your real data
3) Create a YouTube Analytics Dashboard from Template & map your data
4) Put the dashboard into OptiSigns and display on your screens
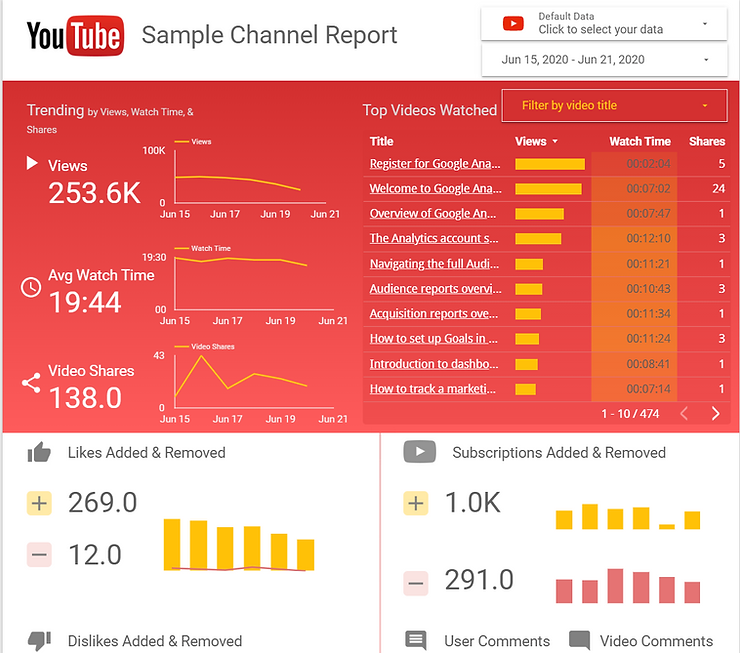
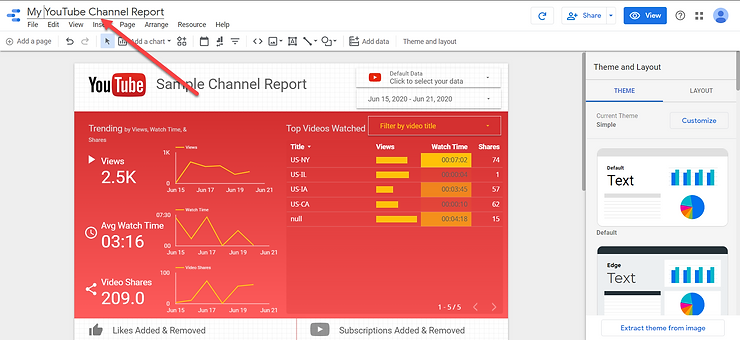
Here's how your dashboard would look. This template has:
- Views
- Avg. Watch Time
- Shares
- Top video statistics
- Interaction (Subscription, Like, Comments)
Of course, you can edit to add data that you'd like to see.
Let's dive in on how to get this created.
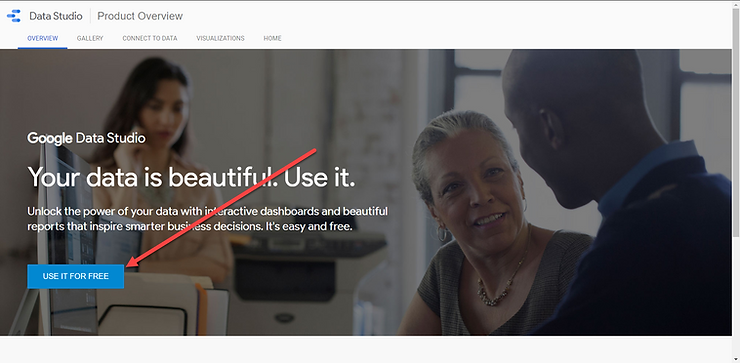
1) Create and account & Log in to Google Data Studio (it's free)
Google Data Studio is Google's free business intelligence and dashboard tool. Using it, you can connect to a wide range of data sources and create reports, dashboard.
Go to https://datastudio.google.com/ and log in with your Google Account.
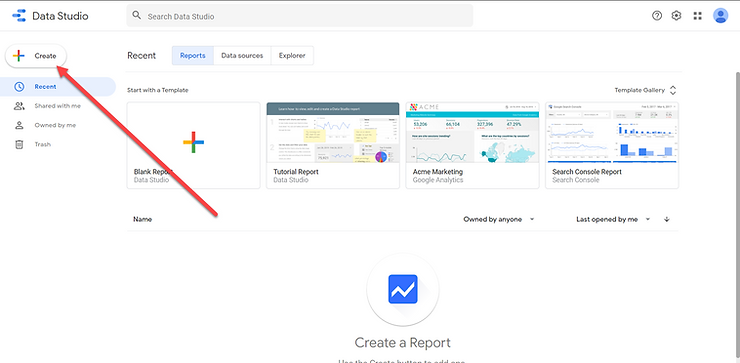
2) Link your YouTube account to get your real data
After logging in you will see this page. Click Create
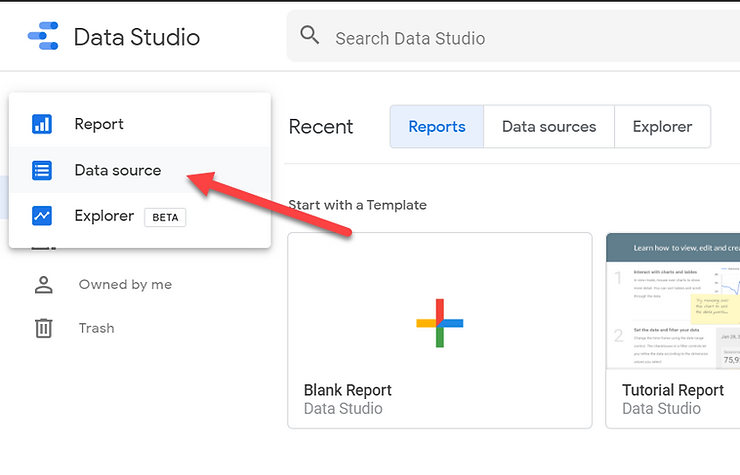
Then click "Data Source"
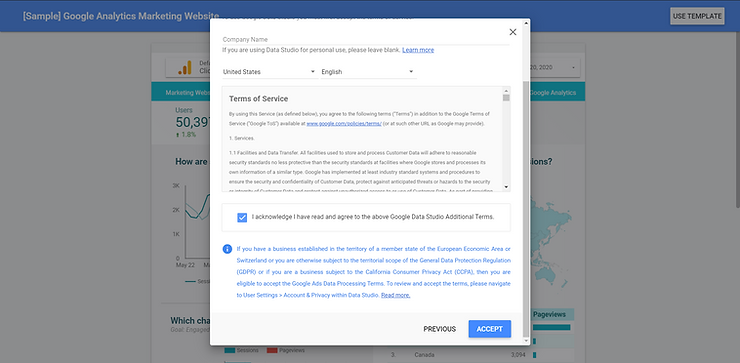
You may need to accept the Google Terms if this is your first time using Google Data Studio.
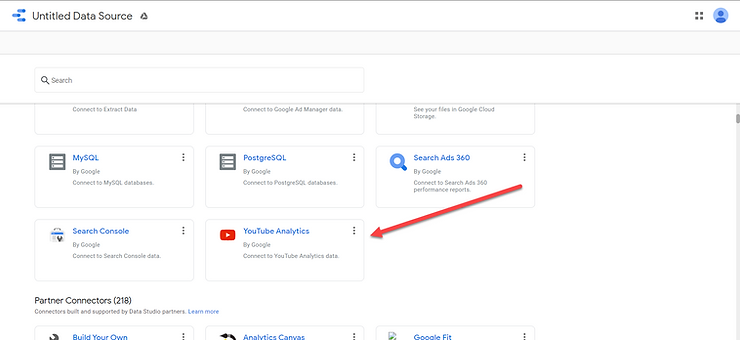
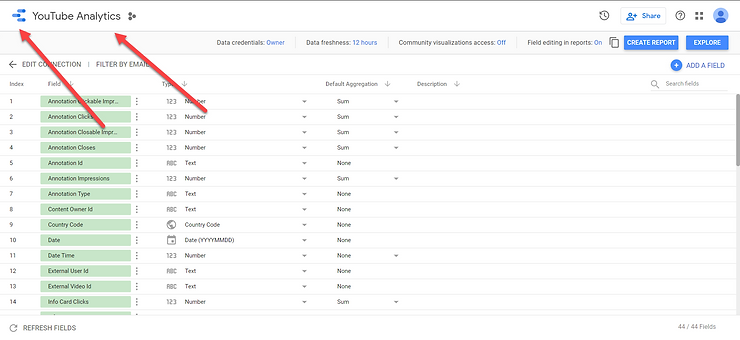
Then scroll down to find YouTube Analytics and click on it
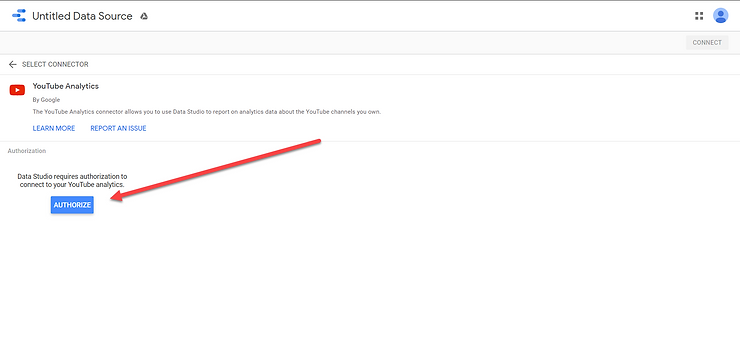
Click "Authorize"
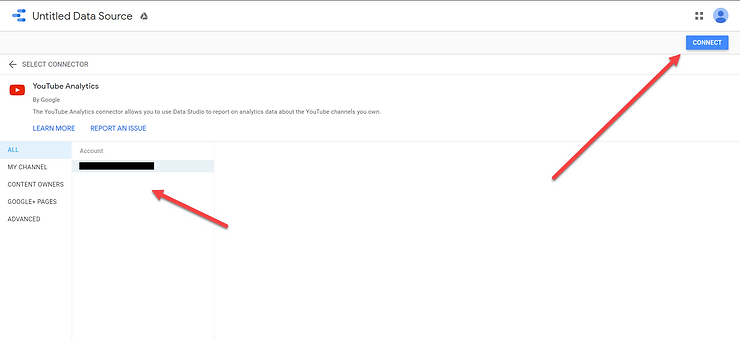
Then select the Account & Report in your YouTube account that you want to use. Google will get data from there & map to this dashboard. Then click Connect.
You can rename the Data Source by clicking on its name.
When you done click on the Data Studio Icon on top left to return to home.
3) Create a YouTube Analytics Dashboard from Template & map your data
Click on "Report" tab and click on Templates to expand.
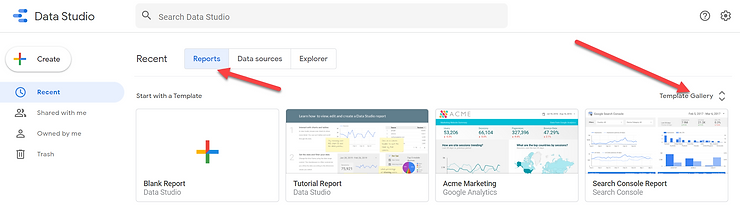
Then select "YouTube Channel Report" Template
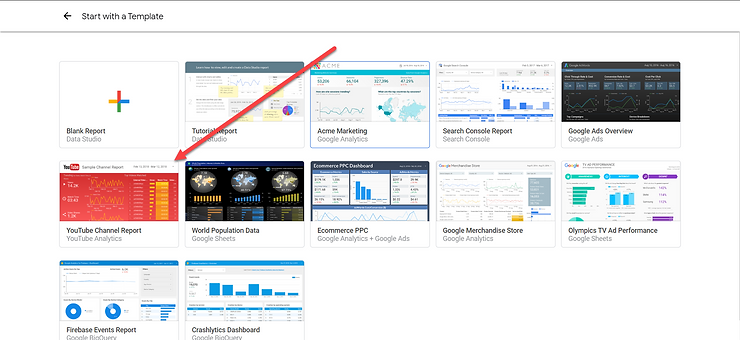
Then Click "Use Template"
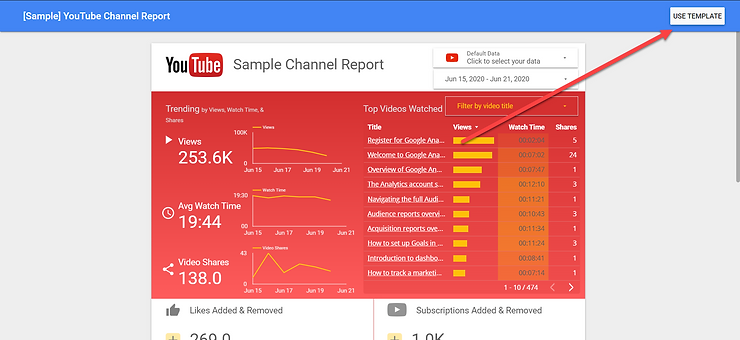
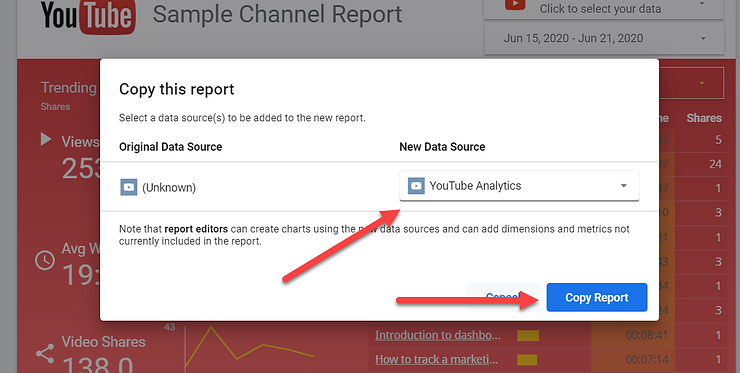
Select the Data Source that you just created in the previous step, this will tell Google to map your data to this template.
Then click "Copy Report"
Then you can rename the Dashboard.
And feel free to modify the dashboard to your liking, or you can just use it as is.
Once you done editing, click Share, then Embed

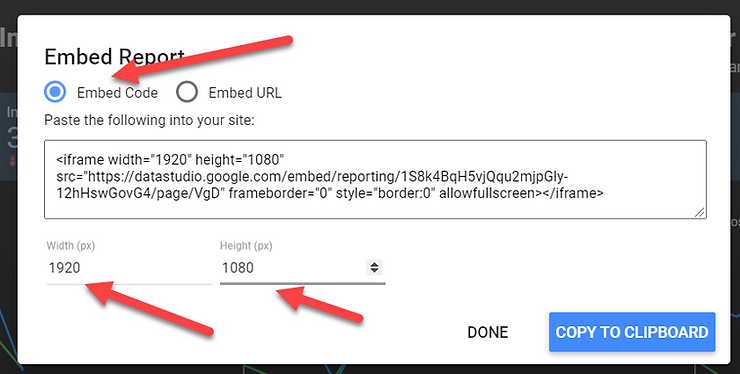
Then click Enable Embedding -> Embed Code
Change Width to 1920, Height to 1080 (best resolution for Digital Signs, you can use 4K if your TV and player support it, it may make the text a bit too small to read).
Then click "Copy to Clipboard"
Now you are ready to put this Embed Code to OptiSigns and display on your digital signs.
4) Put the dashboard into OptiSigns and display on your screens
First, you will need to have your screens set up and paired. For more information on how to do that, click here.
Then log on to our portal: http://app.optisigns.com/
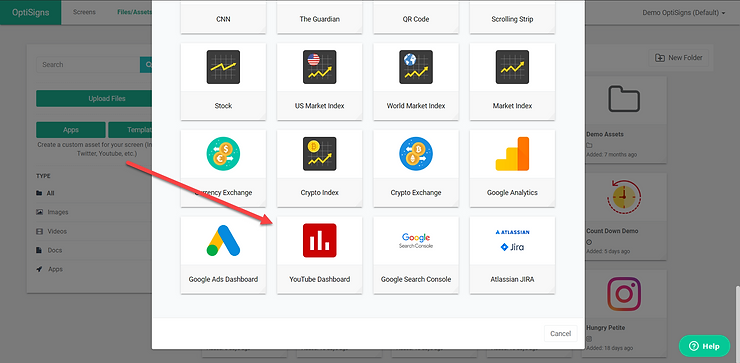
Go to Files/Assets, Click on "App"
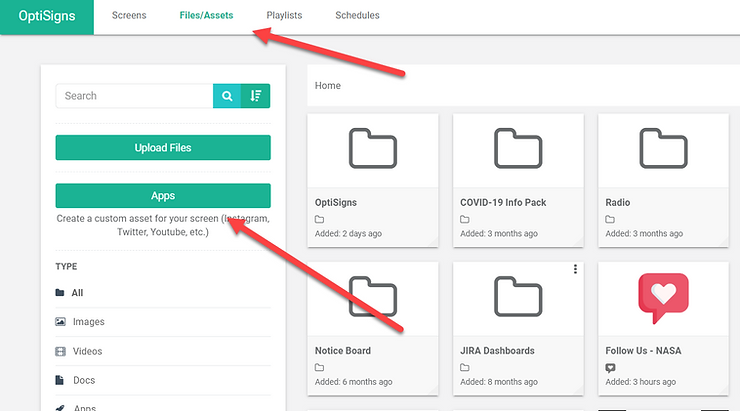
Click YouTube Dashboard app
Enter a name for your assets & paste the Embed Code copied from Data Studio here.
You can also set refresh interval so OptiSigns will refresh the dashboard for you.
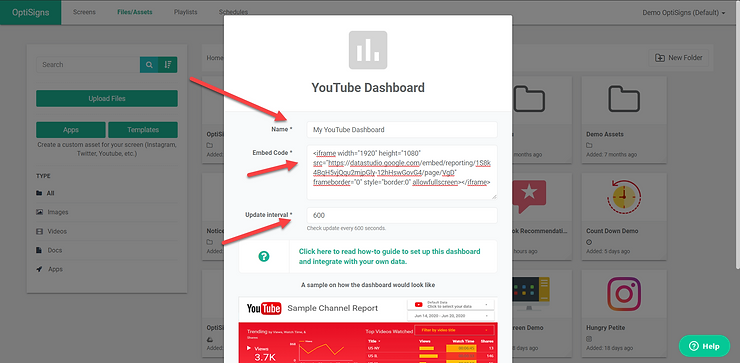
Then click Save.
Your YouTube Dashboard for Google Data Studio asset is created in OptiSigns and ready to be assigned to your screen.

That's it!
You have created a Google Data Studio Dashboard that connected to your live Google Analytics Dashboard, and you have put it in OptiSigns.
You can assign the newly created wall to your screen by going to Screens, click Edit screens and assign the wall to screens that you want.
You can put the created Data Studio dashboard in a Playlist, Schedule too.
Ready to get started?
If you are not using OptiSigns yet, you can sign up now for a free 30 days trial, all features included.


